San Diego Vacation Rental Data By Neighborhood
Introduction
At Farawae, we manage premium vacation rentals across San Diego and obsess over one question: How can each property reach its full revenue potential? This report combines insights from over 2,000 internal reservations with benchmarks from AirDNA, STR.com, and Visit San Diego.
In this report you’ll find our detailed comparisons of STR (short-term rental) vs. hotel performance from neighborhoods across San Diego covering ADR, RevPAR, Occupancy, Length of Stay (LOS), and Booking Lead Time. Whether you’re self-managing or already working with a manager, this analysis will help you benchmark your revenue potential.
Summary of Findings
- La Jolla leads in STR ADR and guest LOS.
- Pacific Beach and Mission Beach dominate in occupancy and weekend RevPAR.
- Golden Hill, North Park, and Bay Park offer high-growth potential.
- Del Mar tops the chart in luxury pricing.
- Downtown STRs excel with longer stays and flexible booking.
STR: ADR: $335 | Occ: 70% | LOS: 4.6 nights
Hotel: ADR: $407 | Occ: 73% | LOS: 2.1 nights
Insight: STRs in La Jolla capture longer, higher-value stays than hotels. Farawae maximizes earnings with minimum-stay rules and elevated design packages.

STR: ADR: $240 | Occ: 77% | LOS: 2.9 nights
Hotel: ADR: $273 | Occ: 83% | LOS: 1.9 nights
Insight: STRs outperform in stay duration and guest flexibility. Farawae properties capture convention overflow and Padres fans with smart pricing around event calendars.
STR: ADR: $218 | Occ: 80% | LOS: 3.8 nights
Hotel: ADR: $250 | Occ: 72% | LOS: 2.0 nights
Insight: STRs dominate here due to lack of hotel supply. Farawae’s local touch and monthly-stay optimization outperform both hotel and peer-hosted listings.

STR: ADR: $285 | Occ: 75% | LOS: 3.8 nights
Hotel: ADR: $310 | Occ: 78% | LOS: 2.1 nights
Insight: One of the most competitive STR zones in San Diego. Farawae listings win via design-forward beachfront offerings and auto-gap fill pricing tech.
STR: ADR: $225 | Occ: 68% | LOS: 4.2 nights
Hotel: ADR: $260 | Occ: 70% | LOS: 2.0 nights
Insight: OB travelers are pet-friendly, chill, and last-minute. Our success here comes from relaxed policies, smart cancellation buffers, and surf-friendly branding.
STR: ADR: $400 | Occ: 66% | LOS: 4.6 nights
Hotel: ADR: $440 | Occ: 73% | LOS: 2.4 nights
Insight: Del Mar STRs shine during summer and race season. We upsell concierge-style services and luxury furnishings to meet high expectations.
Guest Type Trends by Area
Vacationers: La Jolla, Mission Beach, PB | Digital Nomads: Hillcrest, Golden Hill, North Park | Families: Clairemont, Del Mar, Bay Park
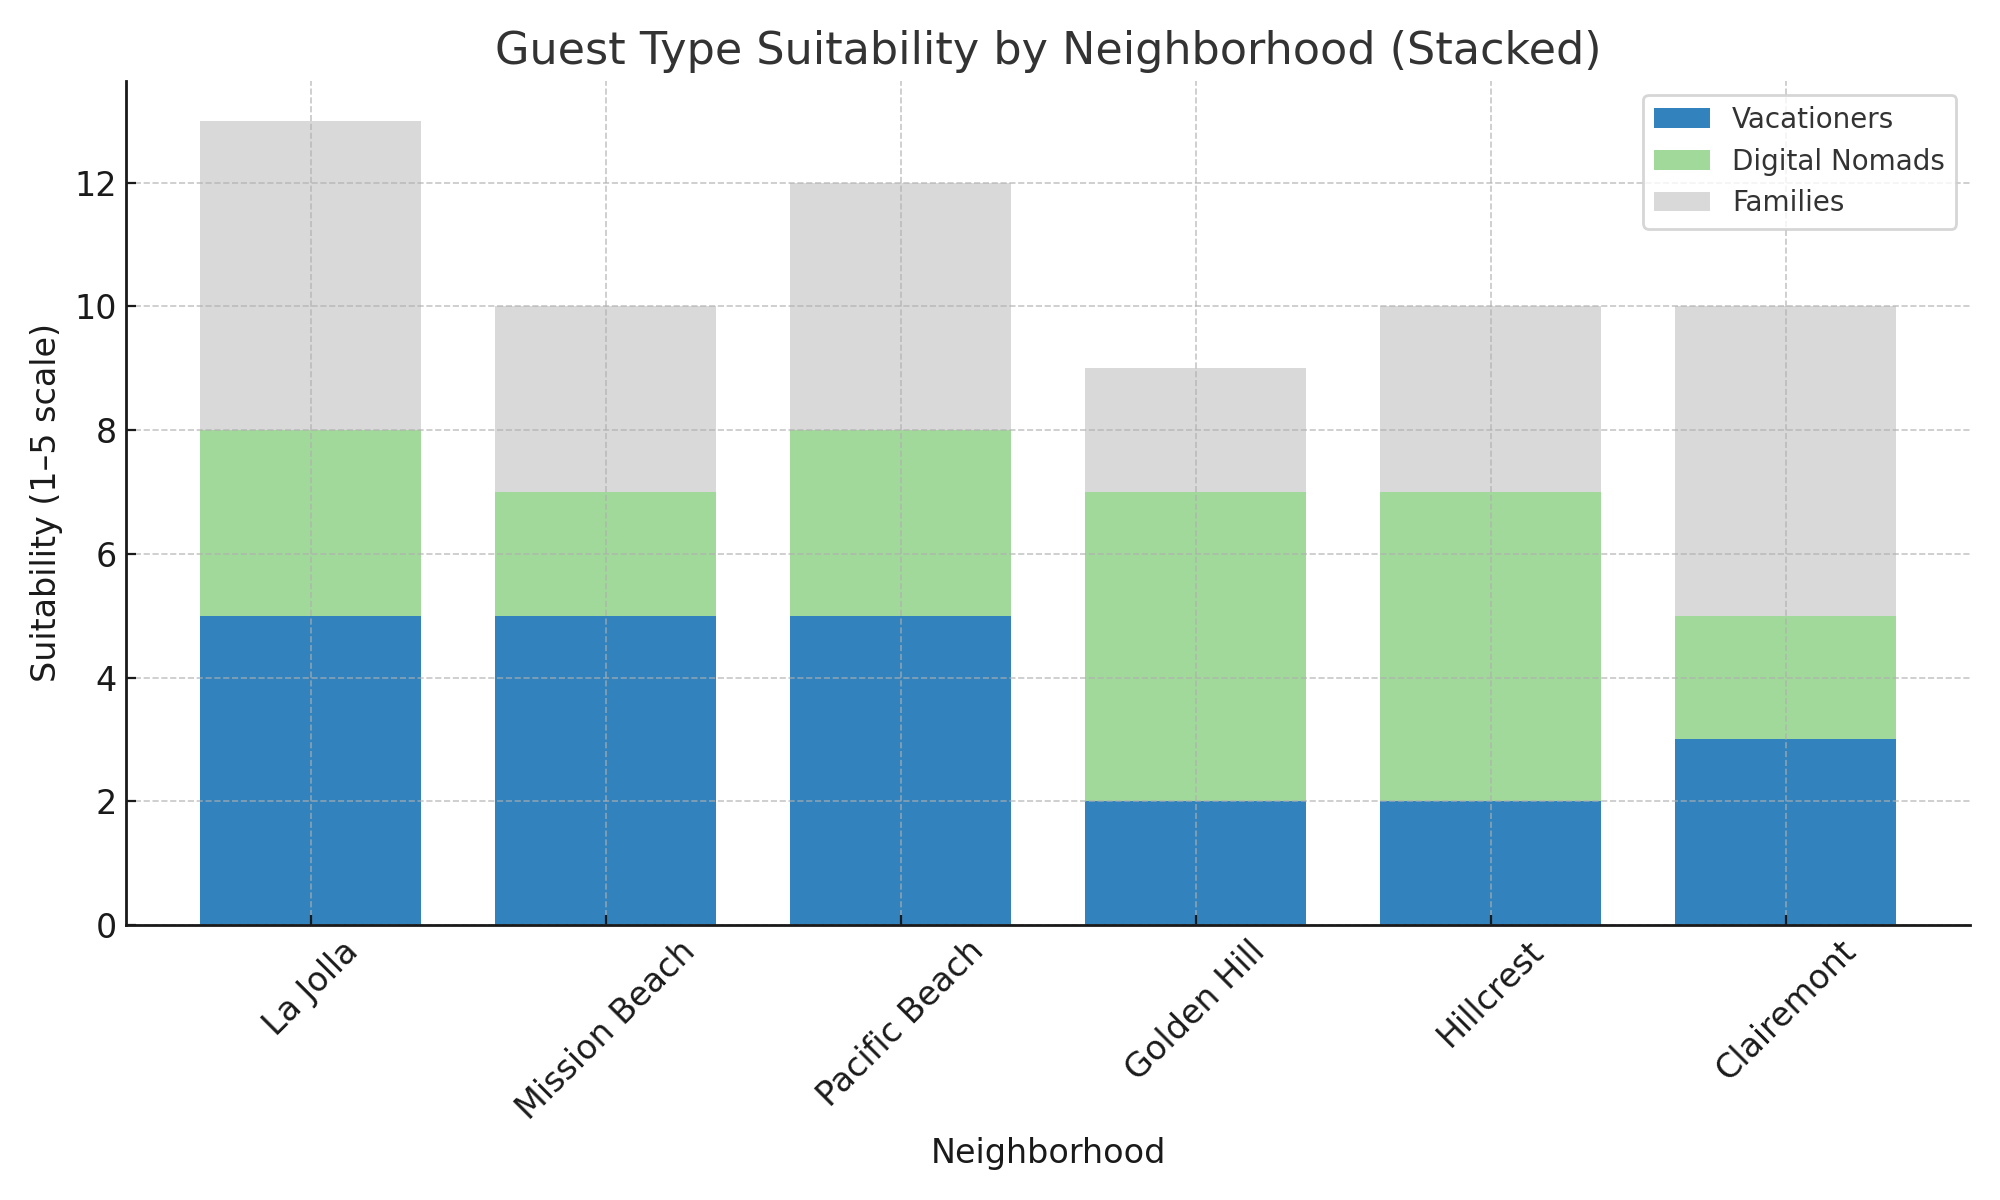
Understanding guest intent is essential for optimizing your vacation rental’s performance. Based on extensive guest behavior and data analysis, we’ve identified clear clustering by traveler type and segmented them into specific neighborhoods. It’s probably not surprising that neighborhoods like La Jolla, Mission Beach, and Pacific Beach are magnets for families or groups seeking a relaxing stay, proximity to water, and the warm-weather and outdoor activities San Diego is famous for. Our Vacationers tend to book 3 to 5 night stays, value amenities like parking and beach gear, and respond strongly to aspirational photography, and flexible check-in options.
The Uptown neighborhoods such as Hillcrest, Golden Hill, and North Park have become hotspots for digital nomads and professionals looking for an extended stay. This is unsurprising due to their central location mixed with amenities attractive to locals which allow for a more authentic San Diego experience. Don’t be surprised if your listings in these areas find guests looking for fast Wi-Fi, monthly discounts, and walkability to restaurants and coworking-friendly environments like locally owned coffee shops. Here, you can outperform peers by tailoring the listing copy to remote workers and offering conveniences like desks, blackout curtains, and self-check-in.
We see families gravitating toward areas like Clairemont, Del Mar, and Bay Park, where homes are larger, quieter, and better suited to strollers, kitchens for cooking, have the space and amenities desirable for extended stays, and the price per guest is more affordable than some other neighborhoods. Listings in these areas tend to perform above average when they highlight things like fenced yards, washer/dryers, and multi-room layouts which consistently attract high-quality family bookings.
One-size-fits-all listings leave revenue on the table. Owners who align their offerings such as design, amenities, rules, and even photography, with their neighborhood’s dominant guest type see stronger reviews, better booking consistency, and higher ADRs. We highly recommend using segmentation in every listing launch to ensure your property connects with the right guest, at the right time, at the right price.
Licensing and Regulation Strategy
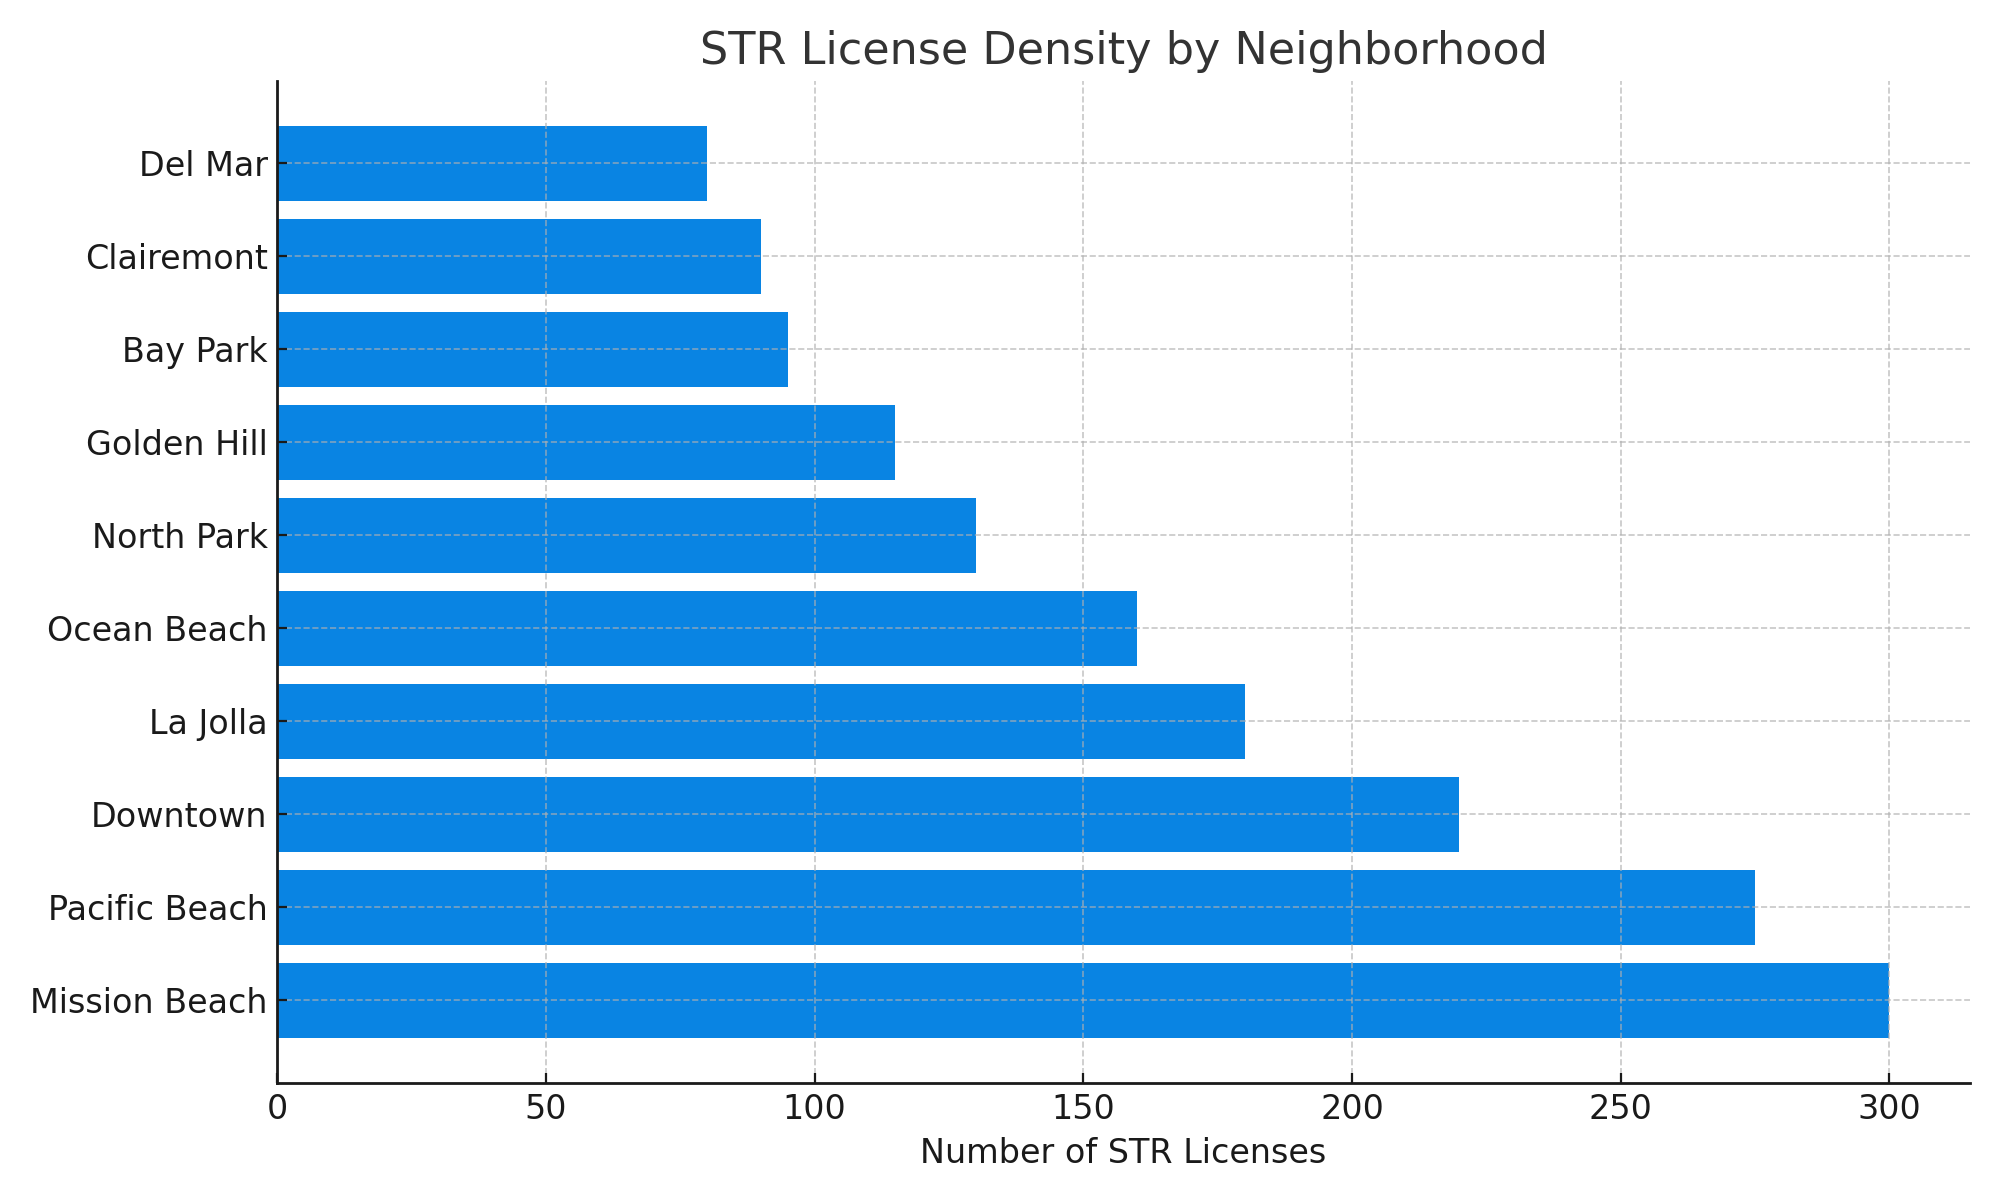
Insights:
- Oversaturated zones like PB, MB, and Downtown require differentiation.
- Inland neighborhoods like North Park and Bay Park offer more licensing flexibility with fewer active competitors.
We recommend mapping neighborhood guest types and STR density to identify the best go forward strategy for your listing.
Takeaways for Owners
STRs match or beat hotels in RevPAR when managed right.
Guest fit, booking behavior, and STRO zoning vary dramatically by neighborhood.
An data-backed playbook driven by trained AI consistently lifts revenue 15–30% over competing listings.
Let’s position your listing for Top Hosting status—where performance speaks louder than claims.





Leave A Comment